Covid-19 canvon rendering
JHU 20200822
Plots based on data from Johns Hopkins University about the progression of Covid-19 (Corona Virus Disease started 2019, see Wikipedia.)
Data as of 20200822, (but see graphs for details).
This is plot run 20200823_140224.
Top
(1/17) Plot 1.0 - confirmed cases germany - zoom:
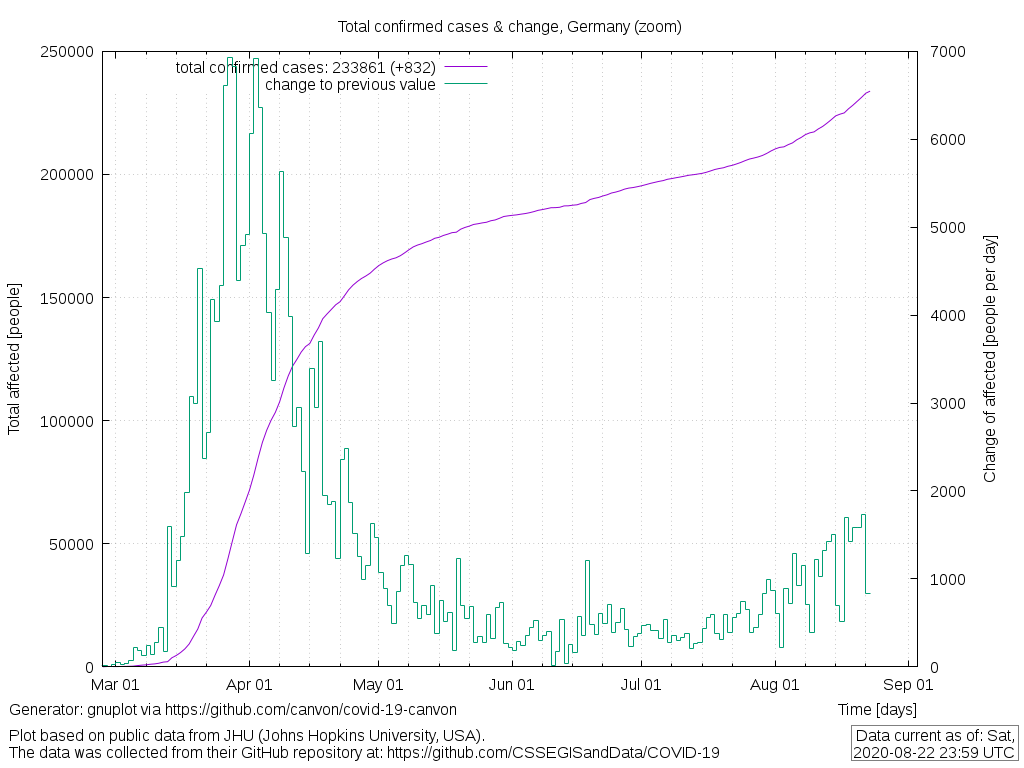
[Full list]. [List entry], [file] for plot 1.0 - confirmed cases germany - zoom.
(2/17) Plot 2.1 - total confirmed cases:
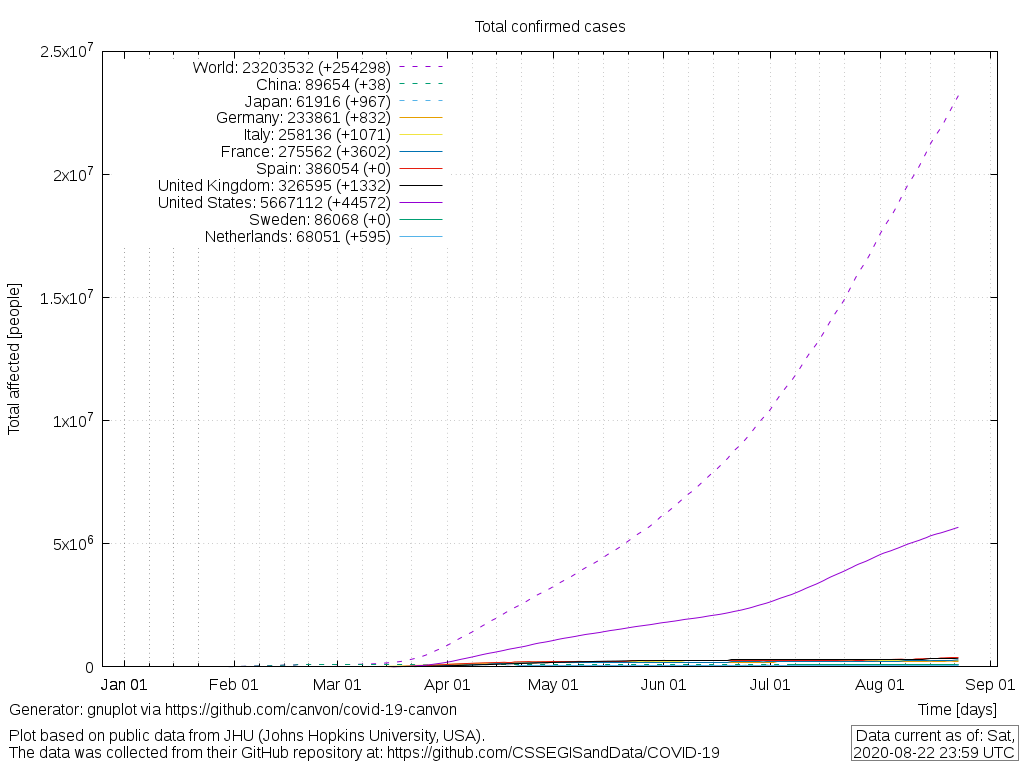
[Full list]. [List entry], [file] for plot 2.1 - total confirmed cases.
(3/17) Plot 2.1b - total confirmed cases - per100k:
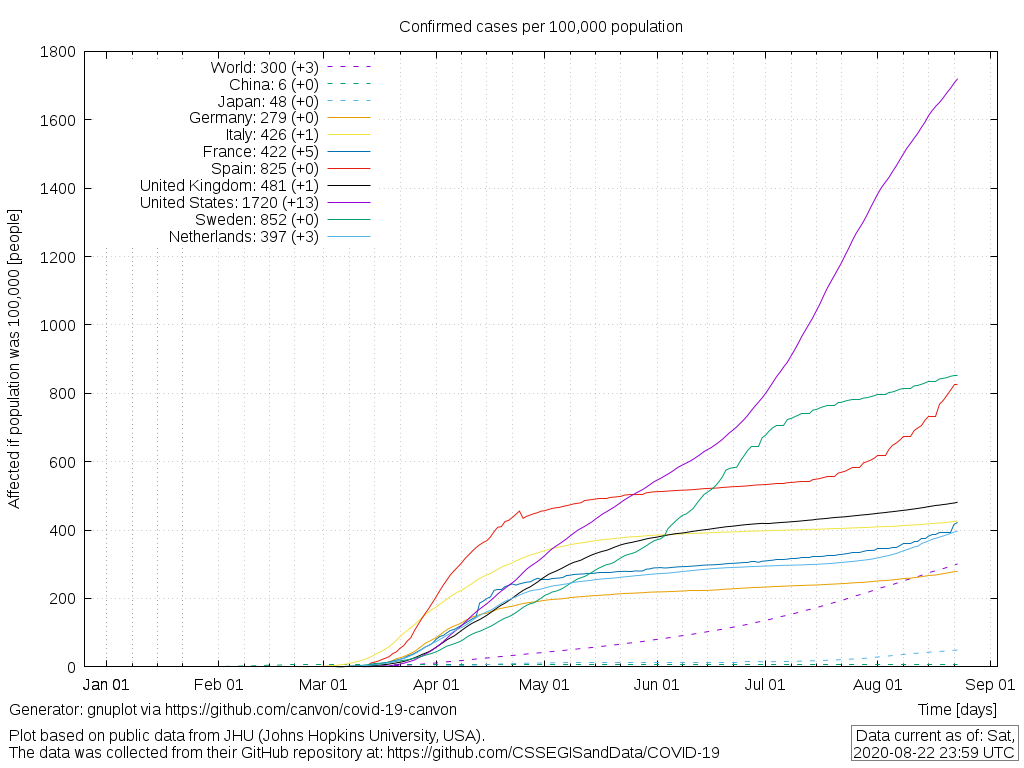
[Full list]. [List entry], [file] for plot 2.1b - total confirmed cases - per100k.
(4/17) Plot 2.1c - total confirmed cases - per100k - logscale:
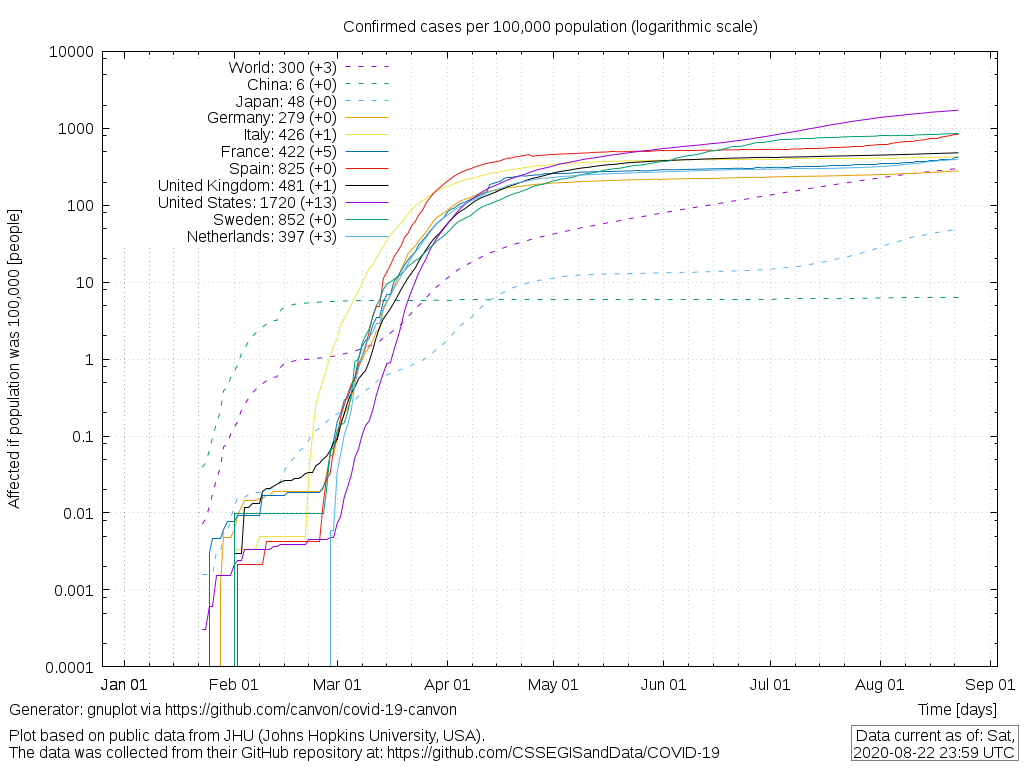
[Full list]. [List entry], [file] for plot 2.1c - total confirmed cases - per100k - logscale.
(6/17) Plot 2.2b - total deaths - per100k:
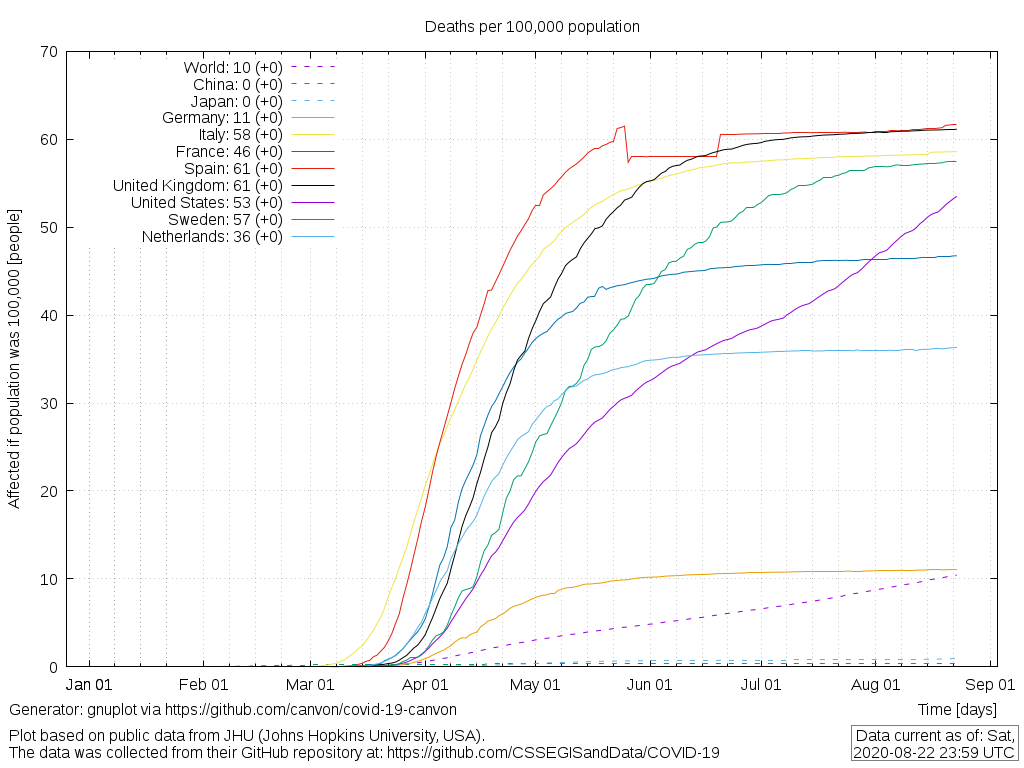
[Full list]. [List entry], [file] for plot 2.2b - total deaths - per100k.
(7/17) Plot 2.2c - total deaths - per100k - logscale:
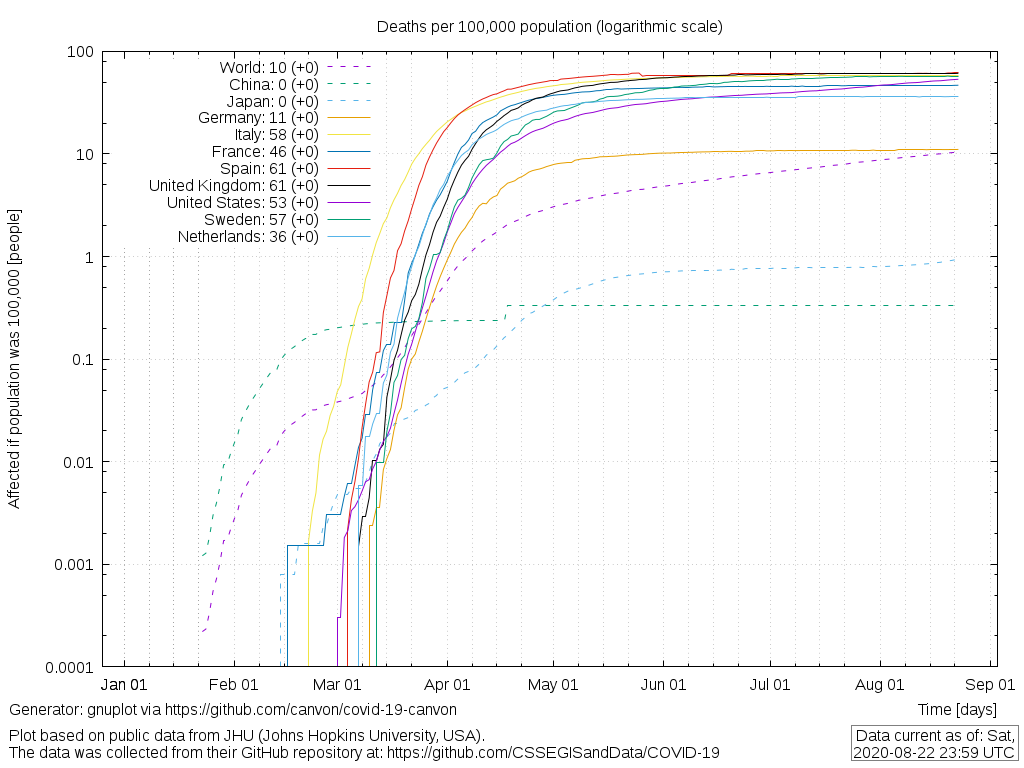
[Full list]. [List entry], [file] for plot 2.2c - total deaths - per100k - logscale.
(8/17) Plot 2.3 - total recovered:
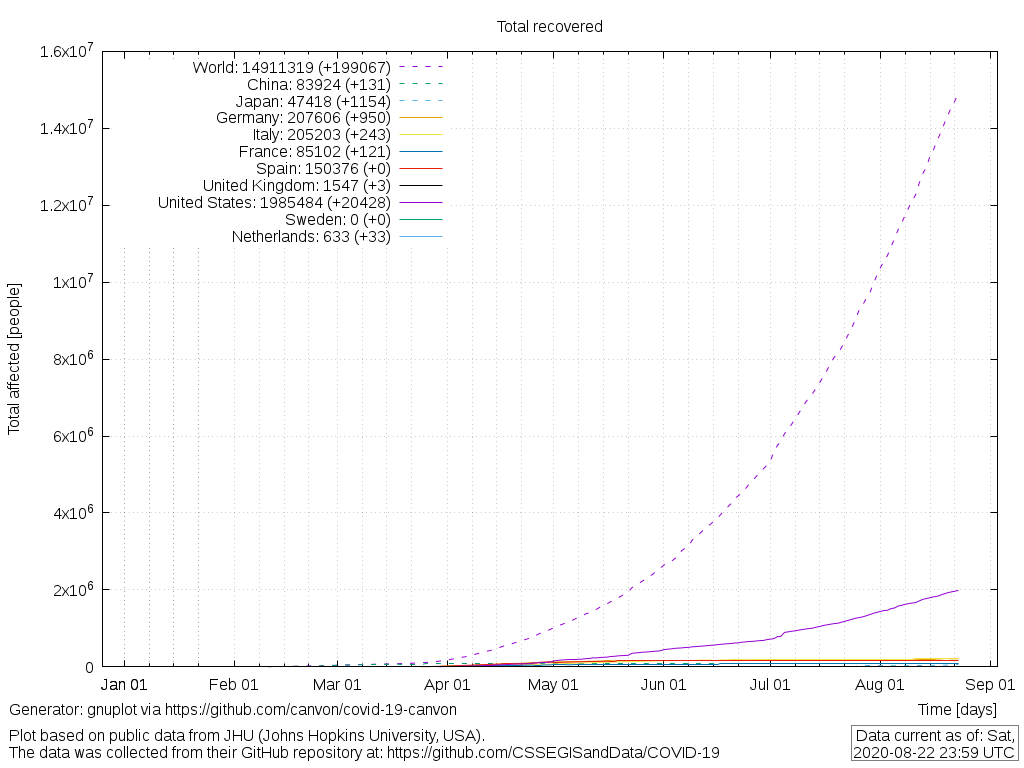
[Full list]. [List entry], [file] for plot 2.3 - total recovered.
(9/17) Plot 2.3b - total recovered - per100k:
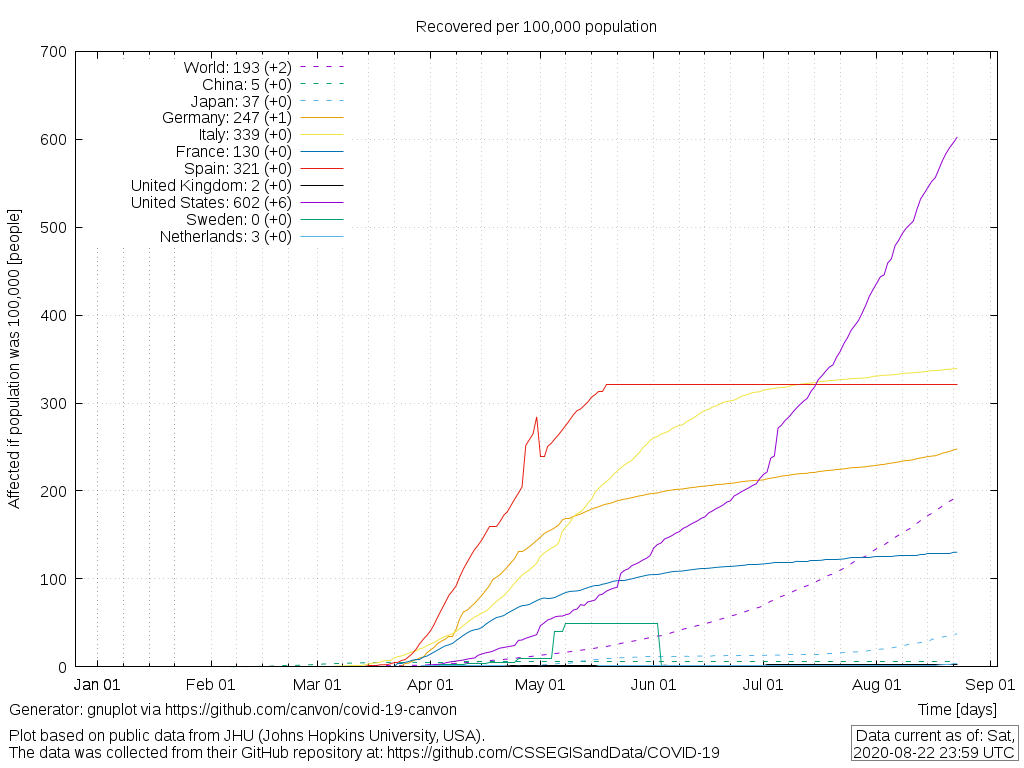
[Full list]. [List entry], [file] for plot 2.3b - total recovered - per100k.
(10/17) Plot 2.3c - total recovered - per100k - logscale:
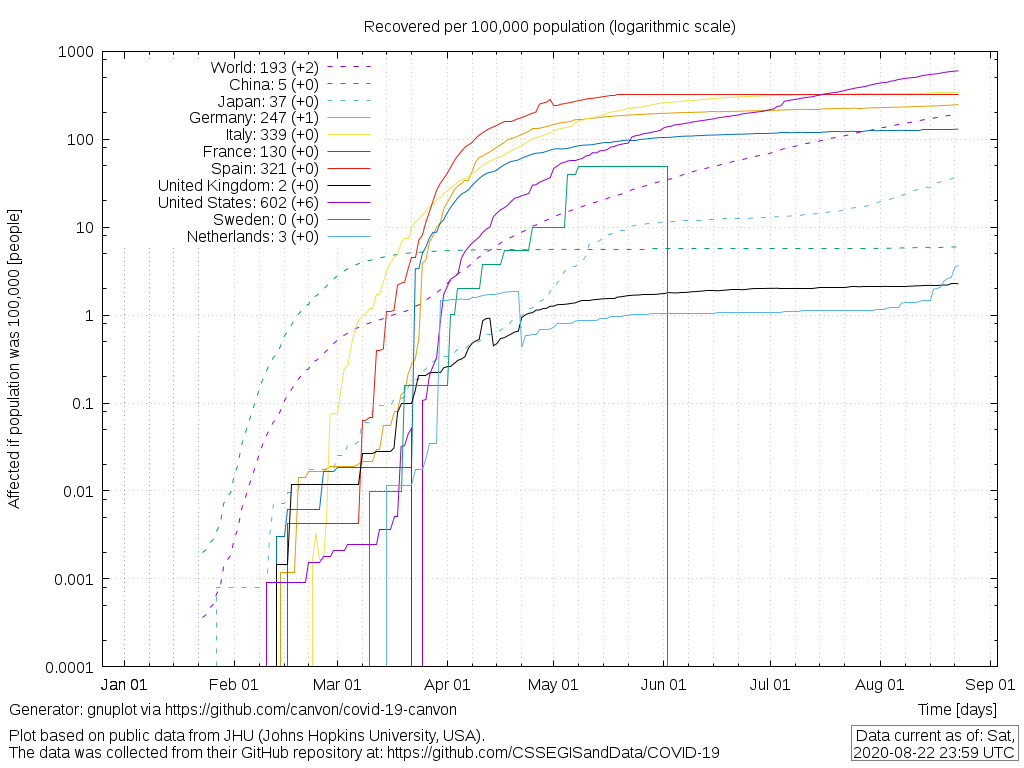
[Full list]. [List entry], [file] for plot 2.3c - total recovered - per100k - logscale.
(12/17) Plot 2.4b - active cases - per100k:
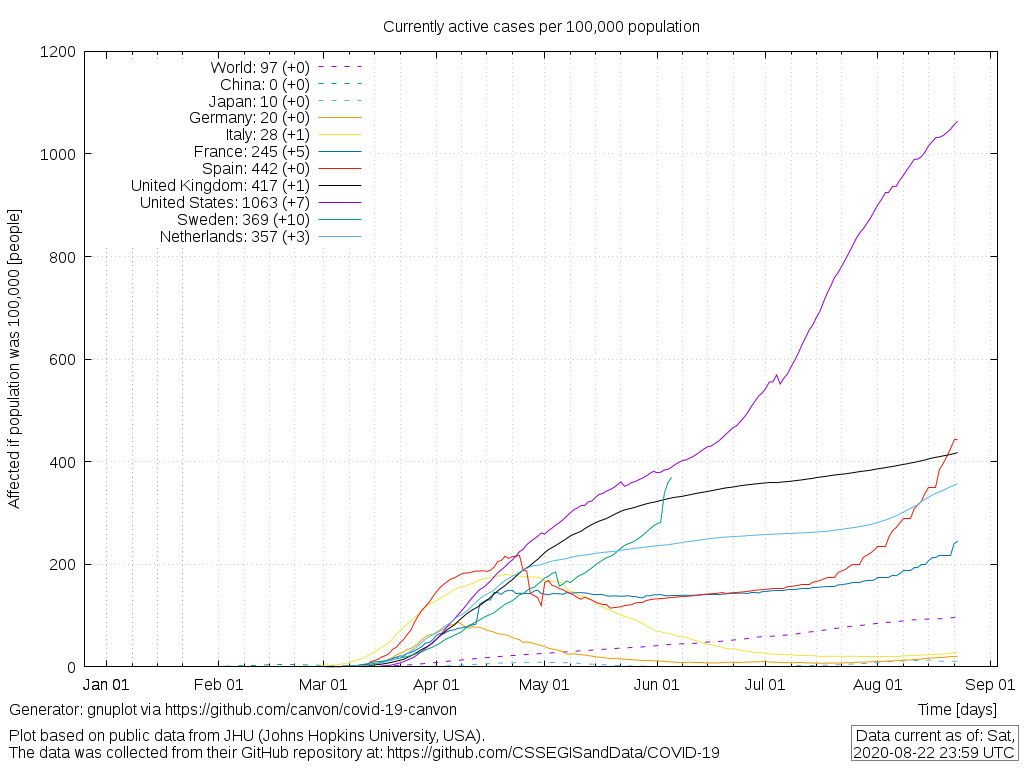
[Full list]. [List entry], [file] for plot 2.4b - active cases - per100k.
(13/17) Plot 3.0 - active confirmed recovered deaths - world:
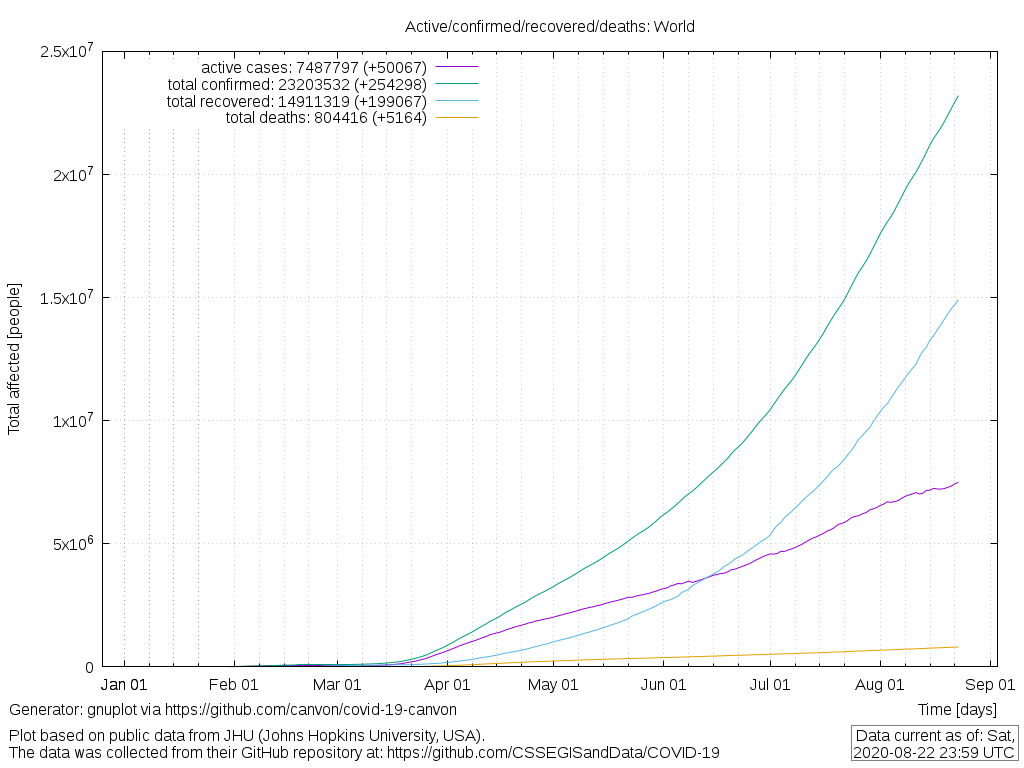
[Full list]. [List entry], [file] for plot 3.0 - active confirmed recovered deaths - world.
(14/17) Plot 3.1 - active confirmed recovered deaths - china:
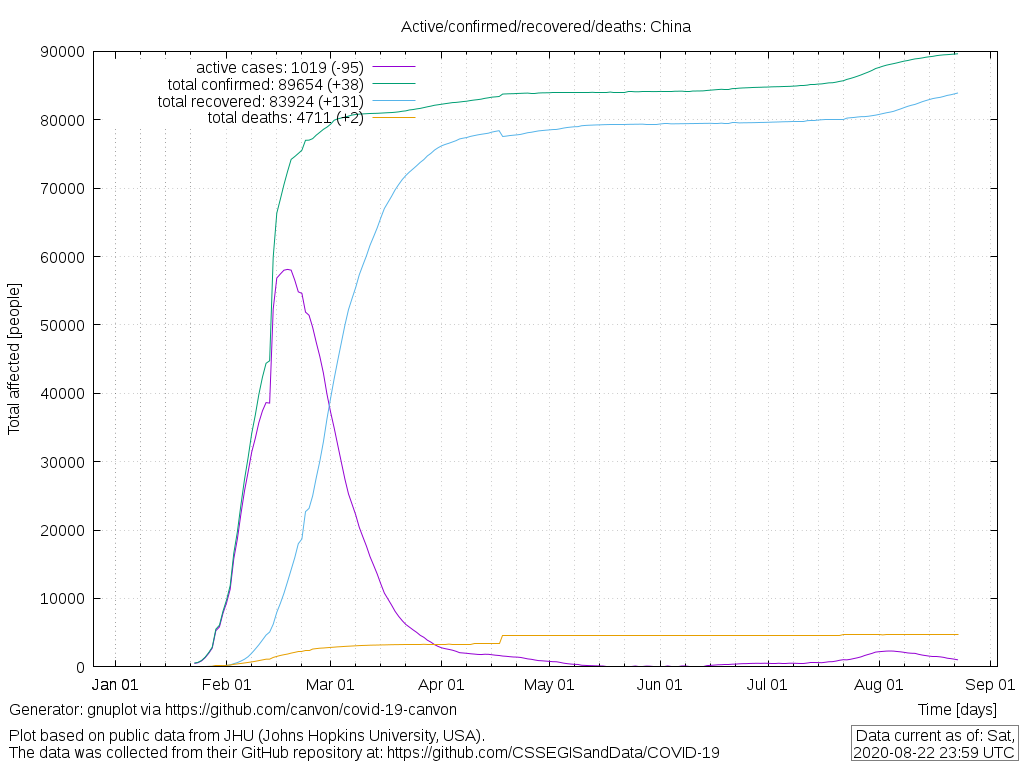
[Full list]. [List entry], [file] for plot 3.1 - active confirmed recovered deaths - china.
(15/17) Plot 3.2 - active confirmed recovered deaths - italy:
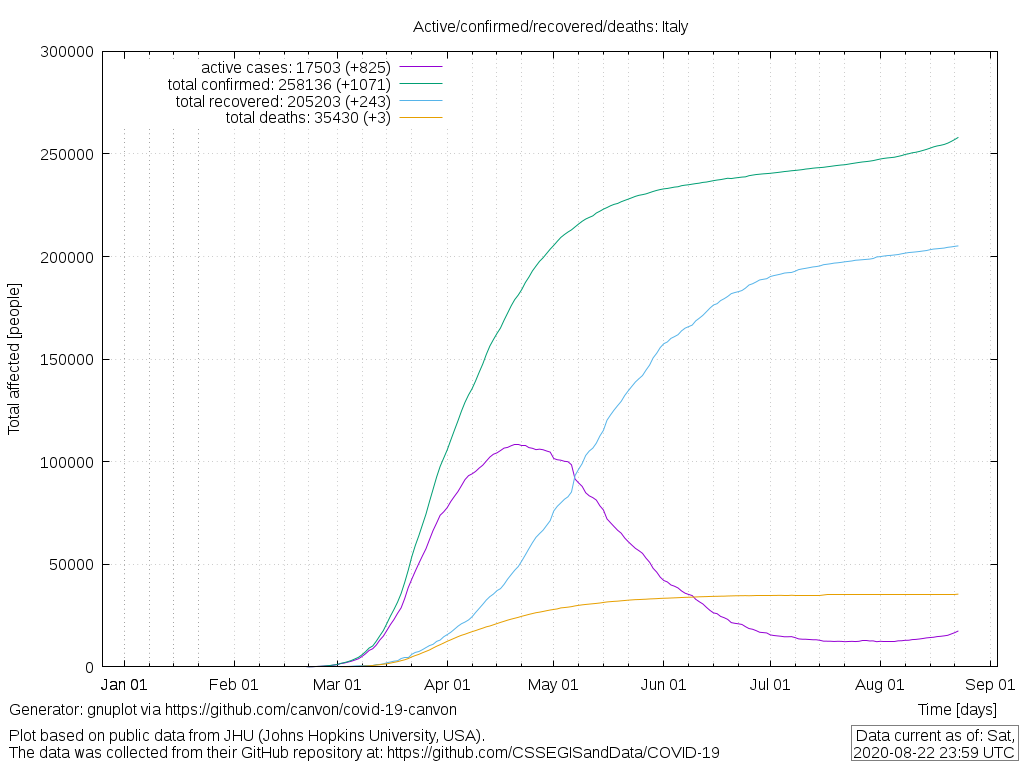
[Full list]. [List entry], [file] for plot 3.2 - active confirmed recovered deaths - italy.
(16/17) Plot 3.3 - active confirmed recovered deaths - germany:
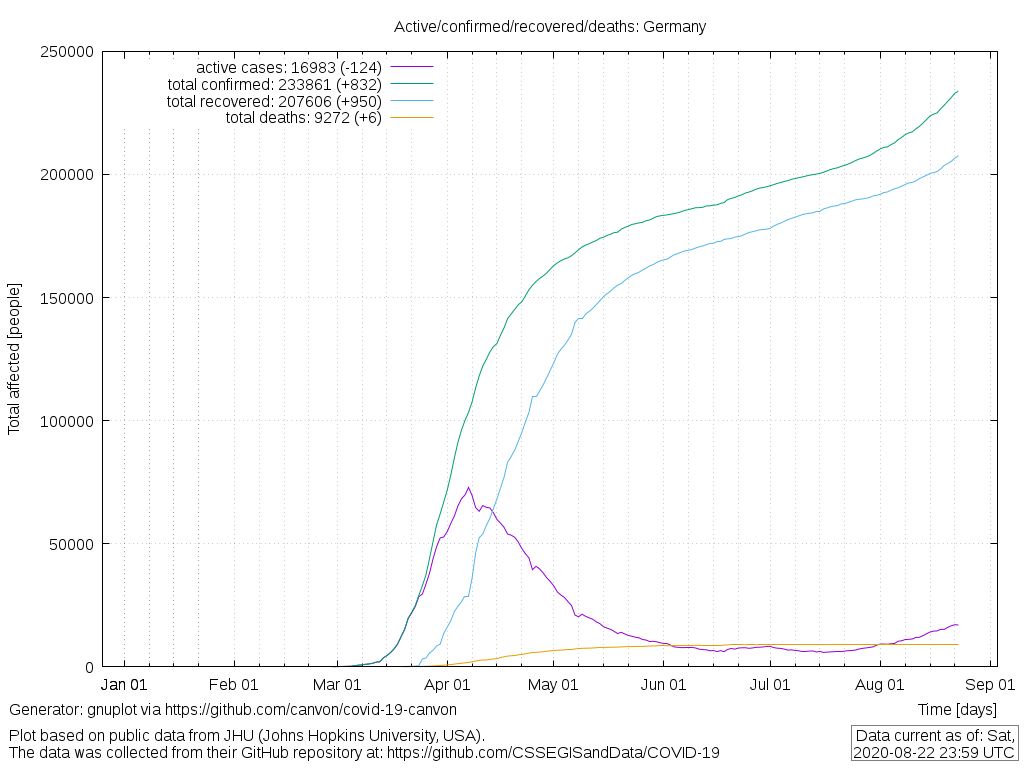
[Full list]. [List entry], [file] for plot 3.3 - active confirmed recovered deaths - germany.
(17/17) Plot 3.3b - active confirmed recovered deaths - germany - logscale:
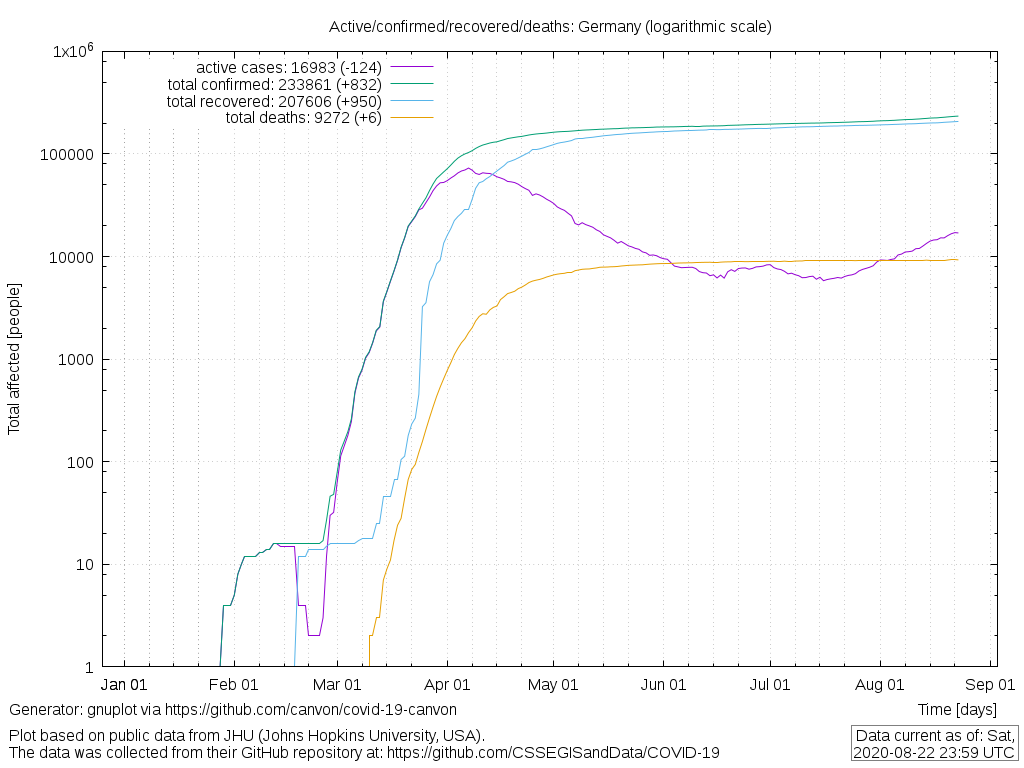
[Full list]. [List entry], [file] for plot 3.3b - active confirmed recovered deaths - germany - logscale.
Public data from Johns Hopkins University collected from: https://github.com/CSSEGISandData/COVID-19
canvon rendering from: https://github.com/canvon/covid-19-canvon
TopJump to a plot directly:
- Plot 1.0 - confirmed cases germany - zoom [file]
- Plot 2.1 - total confirmed cases [file]
- Plot 2.1b - total confirmed cases - per100k [file]
- Plot 2.1c - total confirmed cases - per100k - logscale [file]
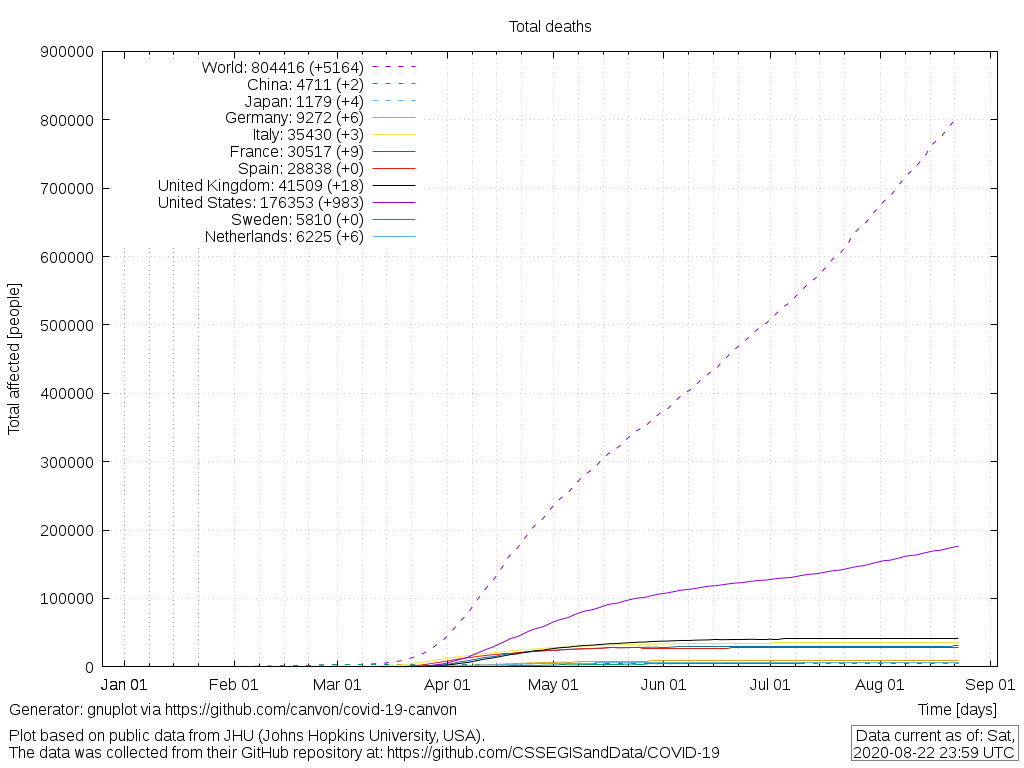
- Plot 2.2 - total deaths [file]
- Plot 2.2b - total deaths - per100k [file]
- Plot 2.2c - total deaths - per100k - logscale [file]
- Plot 2.3 - total recovered [file]
- Plot 2.3b - total recovered - per100k [file]
- Plot 2.3c - total recovered - per100k - logscale [file]
- Plot 2.4 - active cases [file]
- Plot 2.4b - active cases - per100k [file]
- Plot 3.0 - active confirmed recovered deaths - world [file]
- Plot 3.1 - active confirmed recovered deaths - china [file]
- Plot 3.2 - active confirmed recovered deaths - italy [file]
- Plot 3.3 - active confirmed recovered deaths - germany [file]
- Plot 3.3b - active confirmed recovered deaths - germany - logscale [file]